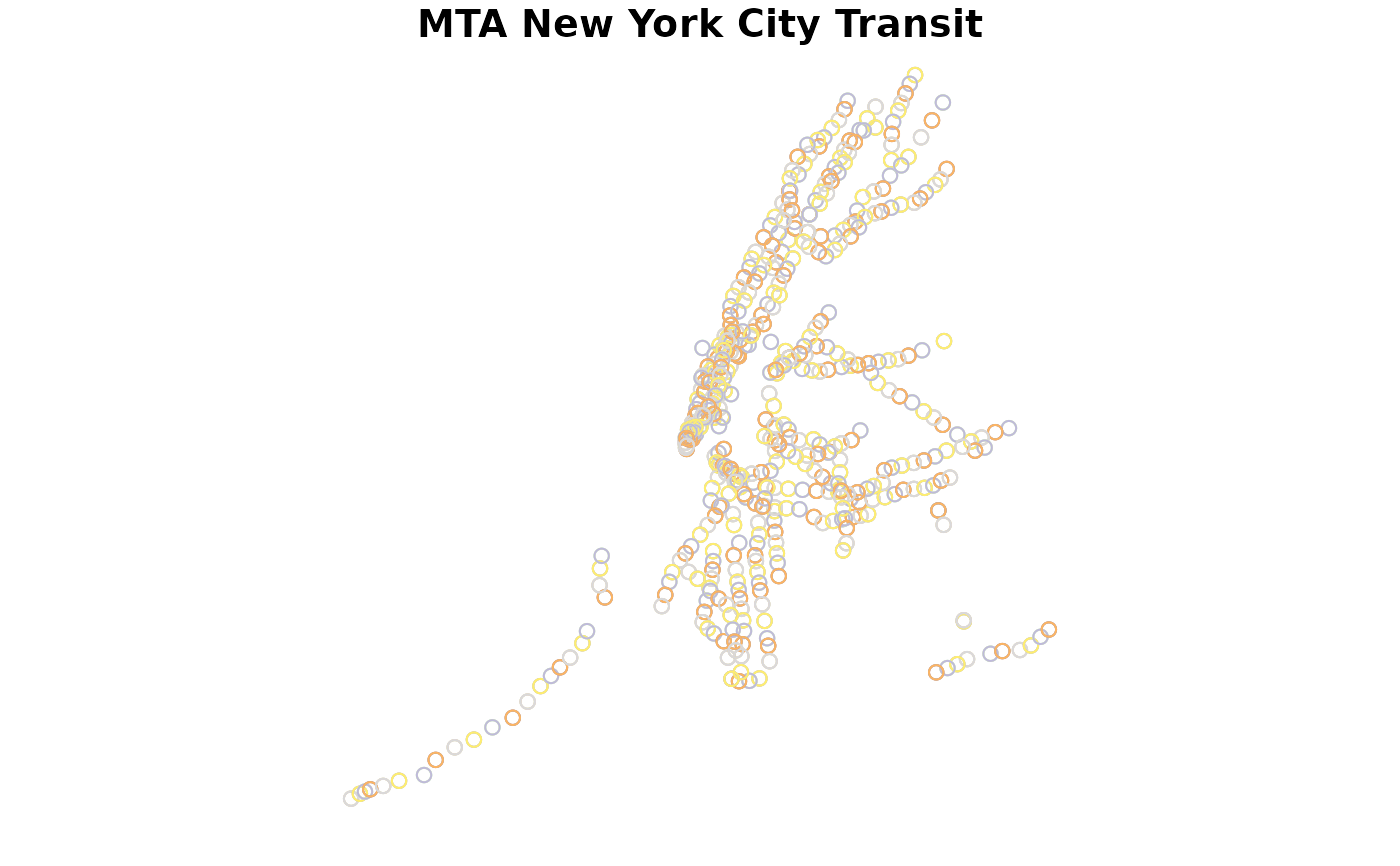
Plot GTFS stops and trips
Usage
# S3 method for class 'tidygtfs'
plot(x, ...)
Arguments
- x
a tidygtfs object as read by
read_gtfs()- ...
ignored for tidygtfs
Examples
# \donttest{
local_gtfs_path <- system.file("extdata",
                              "nyc_subway.zip",
                              package = "tidytransit")
nyc <- read_gtfs(local_gtfs_path)
plot(nyc)

# }
# }